Recording on digital objects (e. g. reports, forms, contracts, mail-order catalogs, source code, manual pages, email, spreadsheets, menus) the interaction events that comprise their use makes it possible on future occasions, when the objects are used again, to display graphical abstractions of the accrued histories as parts of the objects themselves. For example, co-authors of a report can see stable and unstable sections (lines of text are marked by recency of changes or amount of editing) and identify who has written what and when. In the case of reading documentation, a reader can see who else has previously read a particular section of interest. While using a spreadsheet to refine a budget, the count of edits per spreadsheet cell can be mapped onto grayscale to give an impression of which budget numbers have been reworked the most and least. Or in the context of learning unfamiliar menu selections in a new piece of software, the menu itself can depict the distribution statistics of colleagues' previous menu selections in the same or similar contexts. There are many existing computational devices that hint at the prospect of history-enriched digital objects. Automatic change-bars, citation indices, and download counts on computer bulletin boards are examples. In fact, for the last thirteen years, members of our lab have been able to request AP News articles by specifying a minimum number of previous readers and thus easily retrieve articles that colleagues have chosen to read.

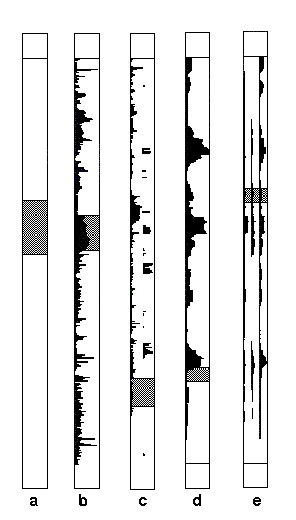
Edit Wear: Existing text editors have been modified to count edits on a per-line basis within user-defined categories such as author or edit session. One way we make that data available is as marks mapped onto scroll bars. Look at scrollbars (b) and (c) in the above image. In scrollbar (b) one can readily see where edits were performed on the document - where the editorial effort has been placed. In scrollbar (c), the work of two coauthors are teased apart into two vertical bands in the scrollbar. Other displays can be added for who performed edits, edit age, and amount of time spent on them. Such attribute-mapped scroll bars have the very nice property of collocating information display with navigation control points.
Read Wear: We also record the amount of time each line is viewable on the display and support search by user-defined categories permanently associated with read-only documents. For example, in the above figure one can see in scrollbar (d) time spent reading various sections of the document. Scrollbar (e) shows three readers "readwear" in three vertical bands. This technique can be used to identify people who have recently consulted a manual page for a topic of interest.

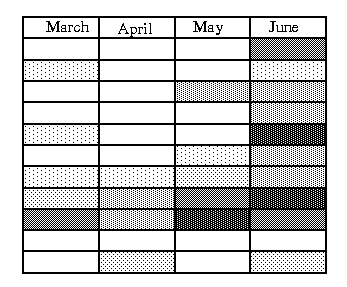
Spreadsheet Wear: In the context of financial planning, spreadsheets are employed to rework the numbers. As illustrated above coloring spreadsheet cells by the number of recalculations makes visible the otherwise invisible hot spots of planning.
See one of the original references:
William C. Hill and James D. Hollan. History-Enriched Digital Objects: Prototypes and Policy Issues in The Information Society, Volume 10, Number 2, April-June, 1994.


Copyright 1994, 1995 Bell Communications Research