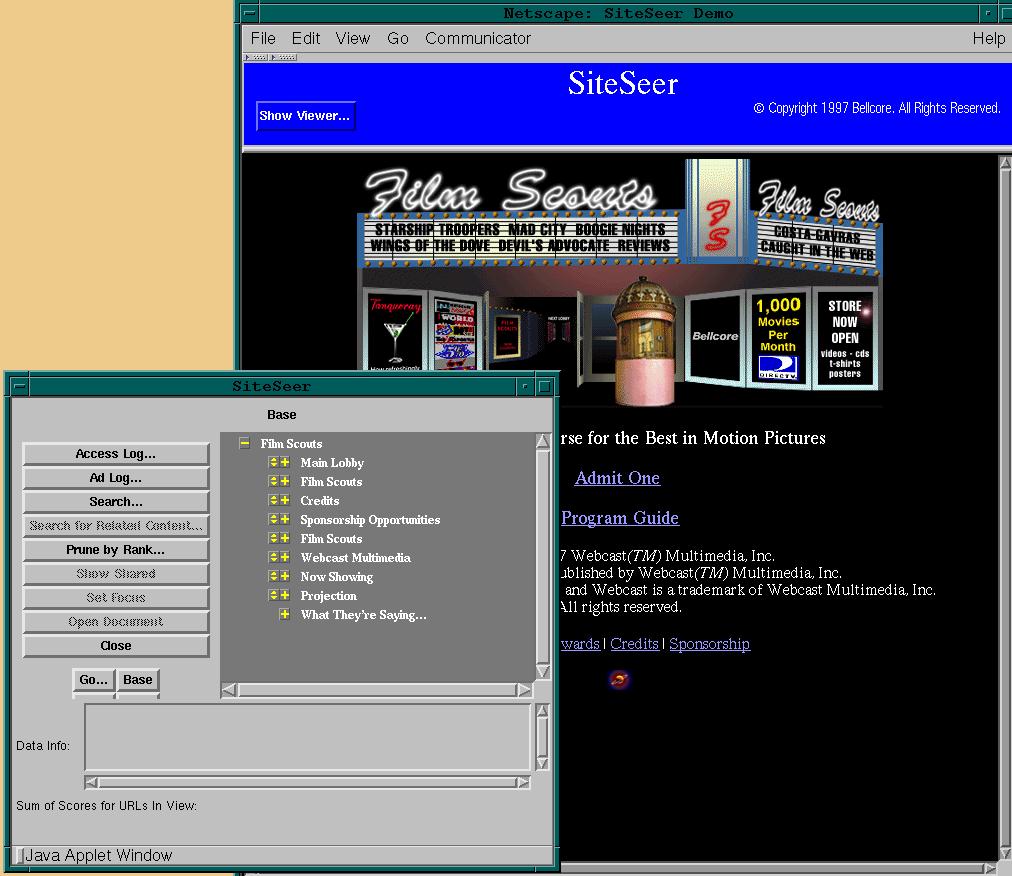
 This slide shows the SiteSeer interface. Behind the SiteSeer window
is the front page of the site being studied.
This slide shows the SiteSeer interface. Behind the SiteSeer window
is the front page of the site being studied.
 This slide is a close-up view of the SiteSeer interface. On the
right is the tree view of the site (currently showing the top level
pages) and on the left are the control buttons for SiteSeer.
This slide is a close-up view of the SiteSeer interface. On the
right is the tree view of the site (currently showing the top level
pages) and on the left are the control buttons for SiteSeer.
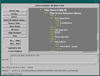
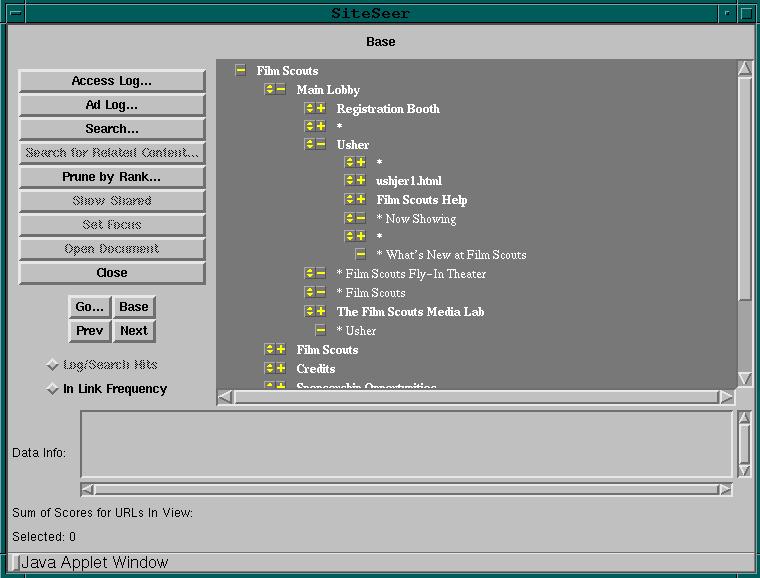 This slide shows the site tree expanded. The two boxes next to
each node (or page) control the visibility of children pages. The
rightmost box (with either a plus or minus icon) allows the tree
to be expanded or collapsed by the user. The leftmost box (with the
up-arrow, down-arrow icon) allows subsets of children nodes to be
collapsed.
This slide shows the site tree expanded. The two boxes next to
each node (or page) control the visibility of children pages. The
rightmost box (with either a plus or minus icon) allows the tree
to be expanded or collapsed by the user. The leftmost box (with the
up-arrow, down-arrow icon) allows subsets of children nodes to be
collapsed.
 SiteSeer allows a user to view various perspectives on the site.
Discussed here are a content perspective, a traffic perspective, and
an ad log perspective.
SiteSeer allows a user to view various perspectives on the site.
Discussed here are a content perspective, a traffic perspective, and
an ad log perspective.
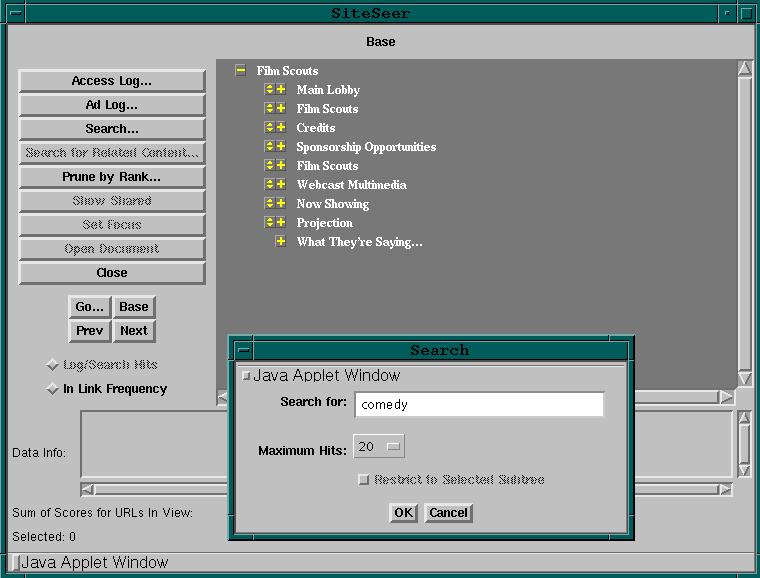
This slide shows viewing the site by content. With the site tree collapsed to the topmost nodes in the background, the foreground shows a menu that allows the user to search for pages having to do with comedy. The tree will be expanded to show pages having to do with comedy.
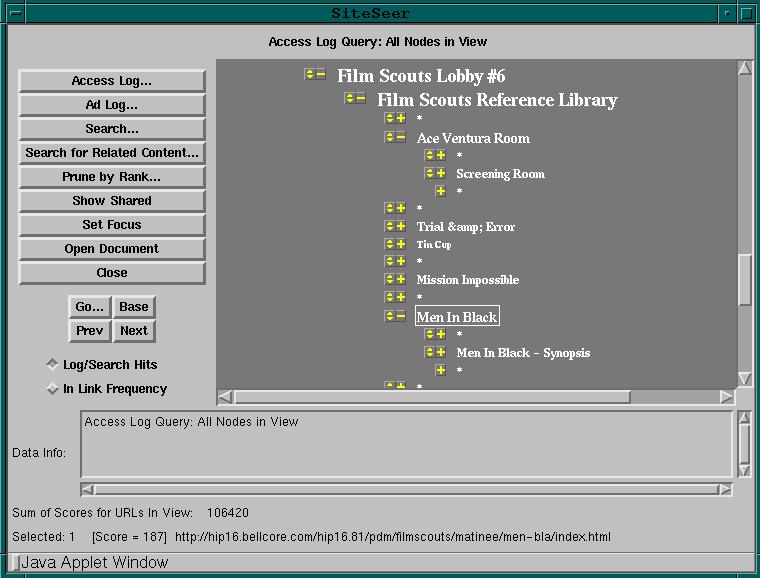
- Access Log results for Men in Black
 This slide shows a section of the site tree expanded to show
pages related to comedy. Posted against this tree is the visitor
traffic levels at each of the pages. Larger typefaces indicate more
traffic. The white outline box around the Men in Black page indicates
it is the selected node. At the bottom of the page the indication
[Score = 187] indicates that during the time period of this access
log, 187 visitors have viewed this page. [The authors are unsure
why Mission Impossible was included as a comedy, and we can only
conclude our search engine - Latent
Semantic Indexing has a sense of humor.)
This slide shows a section of the site tree expanded to show
pages related to comedy. Posted against this tree is the visitor
traffic levels at each of the pages. Larger typefaces indicate more
traffic. The white outline box around the Men in Black page indicates
it is the selected node. At the bottom of the page the indication
[Score = 187] indicates that during the time period of this access
log, 187 visitors have viewed this page. [The authors are unsure
why Mission Impossible was included as a comedy, and we can only
conclude our search engine - Latent
Semantic Indexing has a sense of humor.)
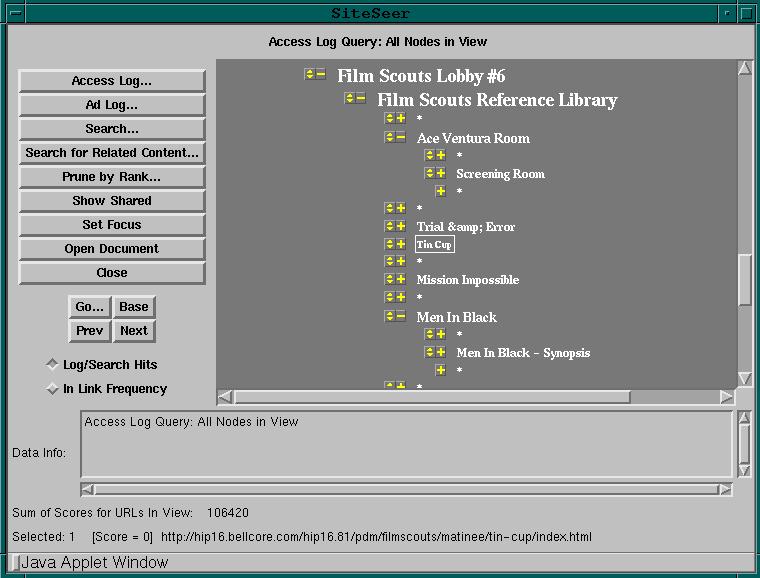
- Access Log results for Tin Cup
 This slide shows the same view as the previous slide, but with
Tin Cup being the selected node. Looking at the bottom of the slide,
we notice that there have been no visitors to the Tin Cup page
in this time period.
This slide shows the same view as the previous slide, but with
Tin Cup being the selected node. Looking at the bottom of the slide,
we notice that there have been no visitors to the Tin Cup page
in this time period.
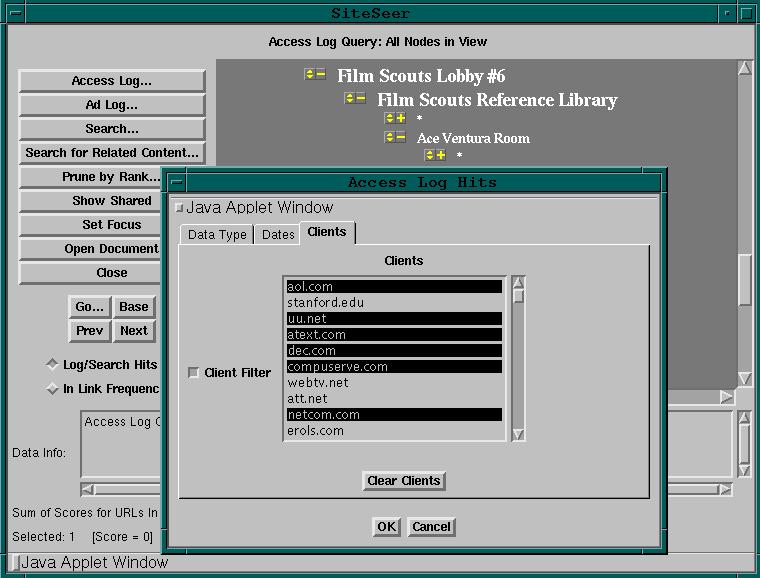 This slide shows a visitor traffic perspective on the site. In
the background the tree is expanded. Larger typeface indicates pages
visited more frequently. In the foreground is a menu that allows the
user to filter these results in various ways. Currently begin shown
is a filter that allows the user to select which sites that traffic
should be reported from.
This slide shows a visitor traffic perspective on the site. In
the background the tree is expanded. Larger typeface indicates pages
visited more frequently. In the foreground is a menu that allows the
user to filter these results in various ways. Currently begin shown
is a filter that allows the user to select which sites that traffic
should be reported from.
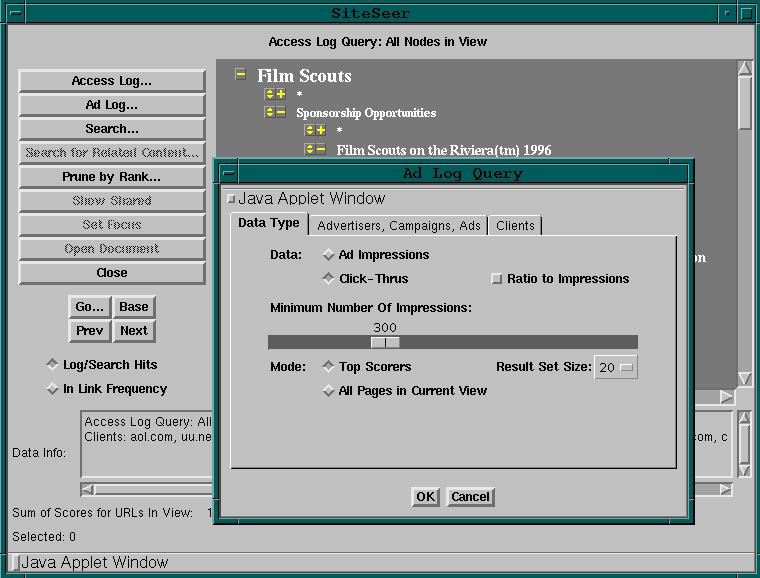 This slide show an ad log perspective on the site. The foreground
menu allows the user to see various ad log statistics, such as
impressions, click throughs or the ratio of click throughs to impressions.
This information will then be posted against the site tree.
This slide show an ad log perspective on the site. The foreground
menu allows the user to see various ad log statistics, such as
impressions, click throughs or the ratio of click throughs to impressions.
This information will then be posted against the site tree.