Peter W. Foltz - Pearson and University of Colorado, Boulder, CO
Mark Rosenstein - Pearson, Boulder, CO
Student interaction log data from formative assessment systems provides windows onto the world of instruction and learning that were previously inaccessible, enhancing insight into challenging problems ranging from the microstructure of learning growth to the impact of instructional strategies. Computer-based instructional environments can allow teachers wide scope in assignment choices. We are interested in understanding item assignment strategies for writing instruction, including how they mix items supplied by the system with items they develop, and how closely they follow the recommended grade level for supplied content. Network visualization (Butts, 2008) enables us to infer alternative teaching styles, allowing in depth investigation of their efficacy, through analysis of student performance under these different regimes.
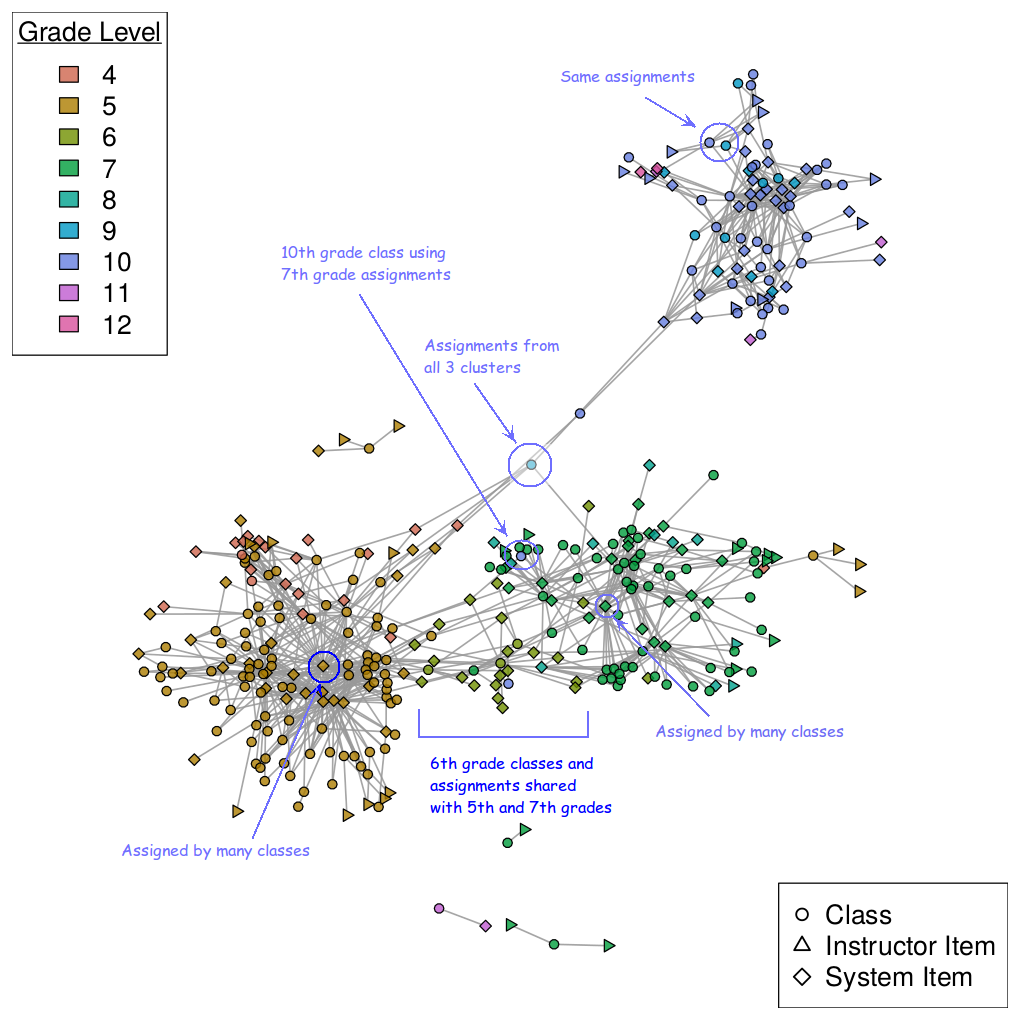
In a statewide implementation of a formative writing system (Foltz & Rosenstein, 2015), we sampled approximately 200 classes represented by circles from the 5th, 7th and 10th grade, and linked their assignments to teacher (triangles) and system (diamonds) provided items. For example, to the left of the center of the figure, there are 4 isolated nodes, a 5th grade brown circle representing a class, that over the school year wrote to two teacher provided items (triangles) and a 5th grade supplied item (brown diamond). Some observations calling out for further investigation are 1) the class in the center of the diagram which had assignments from all 3 clusters, 2) two 10th grade classes in the 7th grade cluster of items, and 3) the characteristics of the items at the cluster centers that are frequently assigned. Such visualizations illustrate their power to aid in understanding patterns of activity in large, heterogeneous formative data, which can lead to more focused research analyses.

Foltz, P. W., and Rosenstein, M. (2015). Analysis of a large-scale formative writing assessment system with automated feedback. In Proceedings of the second ACM conference on Learning@scale conference, 339-342